Real IELTS Examiner Techniques | Practical Structures | Personal Feedback
IELTS Mixed Diagrams
Mixed Diagrams in IELTS Academic Writing Task 1
In IELTS Academic Writing Task 1, mixed diagrams combine two or more types of visuals, such as a pie chart and a table or a line graph and a bar chart.
These tasks test your ability to synthesise and describe different types of data within a cohesive response.
This guide provides a detailed approach to handling mixed diagrams, including strategies, vocabulary, grammar tips, and common pitfalls to avoid.
When approaching mixed visuals, it is important to first identify the relationship between them. Candidates should summarise key trends without describing every detail and maintain logical organisation, often dedicating one paragraph to each visual type or clearly connecting related features.
These diagrams require candidates to describe the sequence and relationships between each stage clearly and logically.
This page provides a comprehensive guide on tackling process diagrams, including strategies, vocabulary, grammar tips, and important techniques for using passive voice correctly. Students are encouraged to transform nouns into verbs and use passive structures to accurately describe stages, ensuring a dynamic and formal writing style.
Candidates should focus on covering all major stages, sequencing events logically, and connecting stages clearly. It is also essential to avoid listing every detail separately; stages should be linked using sequencing words, and descriptions should remain concise and coherent.

Understanding the Task Requirements
Word Count: Write at least 150 words. Responses exceeding 180 words must still maintain focus and clarity.
Time: Allocate around 20 minutes.
Focus Areas: Address Task Achievement, Coherence and Cohesion, Lexical Resource, and Grammatical Range and Accuracy.
Overview: Highlight the key trends or relationships between the diagrams succinctly.
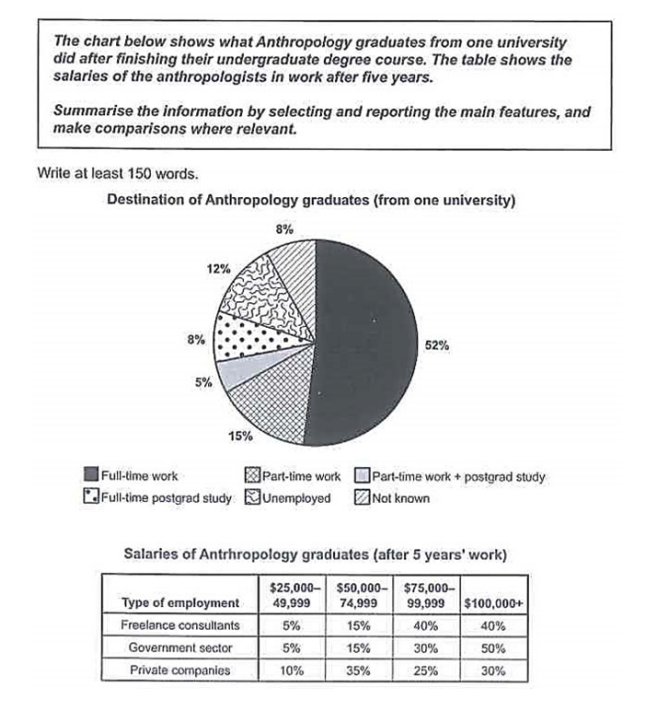
The diagrams show the employment destinations of Anthropology graduates from one university after completing their degree and the salaries of those who found work after five years.
Overall, just over half of the graduates entered full-time work after graduation, while only a small proportion remained unemployed. After five years, graduates working as freelance consultants or in the government sector had higher salary levels compared to those working in private companies.
More specifically, 52% of Anthropology graduates secured full-time employment, while 15% went into part-time work. An additional 8% combined part-time work with further study, and another 8% engaged in full-time postgraduate study. Only 5% were unemployed, while the destinations of the remaining 12% were not known.
Regarding salaries, after five years of employment, half of the graduates working in the government sector earned over $100,000 per year. Similarly, 40% of freelance consultants also reached this income bracket, with another 40% earning between $75,000 and $99,999. In contrast, only 30% of private company employees earned more than $100,000, while a larger proportion (35%) earned between $50,000 and $74,999.
Vocabulary for Mixed Diagrams
Describing Trends and Features:
increase, rise, climb, grow, surge
decrease, decline, drop, fall
remain steady, stabilise, level off
Comparative Language:
larger than, smaller than, higher than, lower than
approximately equal to
Process-Specific Terms:
introduced, transferred, processed, converted, distributed
Descriptive Phrases:
“The pie chart illustrates… while the table shows…”
“The diagrams provide a comparison between…”
“A clear connection is evident between the two visuals.”
Common Pitfalls
Overloading Details: Focus on the most important comparisons, not every number.
Omitting the Overview: Always summarise the main trend of both diagrams early.
Inconsistent Organisation: Group similar ideas and keep one diagram per paragraph where possible.
Inaccurate Comparisons: Only compare figures when relevant and logically meaningful.
Understanding the Task Requirements
Word Count: Write at least 150 words. While there is no strict upper limit, responses exceeding 180 words may introduce unnecessary detail.
Time: Allocate around 20 minutes.
Focus Areas: Address Task Achievement, Coherence and Cohesion, Lexical Resource, and Grammatical Range and Accuracy.
Overview: Highlight the overall process and key stages succinctly.
The diagram illustrates the stages involved in the production of bricks for construction purposes, starting from clay extraction and ending with the delivery of finished products.
Overall, there are seven stages in the process, beginning with the excavation of clay from the ground and ending with the delivery of packaged bricks to customers.
Initially, clay is excavated from the ground using a digger and placed onto a metal grid, where it is filtered and then passed through a roller to remove larger pieces. Following this, sand and water are added to the processed clay, and the mixture is either moulded into brick shapes or cut with a wire to form bricks. The shaped bricks are then placed in a drying oven for a period of one to two days.
Subsequently, the dried bricks are fired in a kiln at moderate temperatures ranging from 200°C to 980°C, and then at higher temperatures between 870°C and 1300°C. After heating, they are moved into a cooling chamber where they are cooled for a further two to three days. Finally, the bricks are packaged and transported to their destination for delivery.
Vocabulary for Process Diagrams
Sequencing Words:
first, initially, at the beginning
then, next, subsequently, after that
finally, at the end, in the last stage
Common Verbs in Passive Voice:
is/are added, mixed, heated, transported, assembled
is/are processed, packaged, delivered, converted, extracted
Descriptive Adverbs:
gradually, carefully, efficiently
rapidly, systematically, simultaneously
Common Pitfalls
Misinterpreting Stages: Ensure all steps are described in the correct sequence without missing major stages.
Overloading Details: Avoid unnecessary repetition or excessive description of minor features.
Inconsistent Tenses: Use the present simple tense consistently in passive constructions.
Ignoring Connections: Ensure that transitions between stages are clear and logical using appropriate linking words.
