Real IELTS Examiner Techniques | Practical Structures | Personal Feedback
IELTS Tables
Tables in IELTS Academic Writing Task 1
Understanding Tables
In IELTS Academic Writing Task 1, tables are frequently used to present data in a structured format, allowing for clear comparisons across categories or over time.
Effectively describing tables requires the ability to interpret numerical information and convey it coherently in writing.
This guide provides a detailed approach to tables, including strategies, structure, and vocabulary, based on a real example.

Understanding the Task Requirements
-
Word Count: Write at least 150 words. While there is no strict upper limit, responses exceeding 180 words may include unnecessary detail.
-
Time: Allocate around 20 minutes.
-
Focus Areas: Address Task Achievement, Coherence and Cohesion, Lexical Resource, and Grammatical Range and Accuracy.
-
Overview: Highlight the key features or notable trends succinctly.
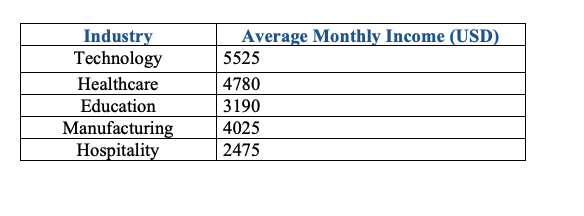
The table illustrates the average monthly earnings, in US dollars, of employees working across five different industries: technology, healthcare, education, manufacturing, and hospitality.
Overall, technology recorded the highest average salary, while hospitality employees earned the least. There was a considerable gap between the top and bottom industries, with manufacturing and healthcare offering moderate income levels compared to the extremes.
Technology professionals earned the highest monthly income at $5,525, followed by healthcare workers at $4,780. Hospitality had the lowest average salary at $2,475, which was less than half the figure recorded for technology and around $2,300 lower than healthcare. This significant difference highlights the disparity between the highest- and lowest-paid sectors.
Manufacturing employees earned an average of $4,025, placing them third overall, while education salaries were slightly lower at $3,190. Although both industries offered more modest earnings compared to technology and healthcare, the gap between manufacturing and hospitality remained considerable. Overall, income levels varied widely across the five industries shown.
Vocabulary for Describing Tables
Describing Values:
-
High Values: the highest, the largest, the most significant
-
Low Values: the lowest, the smallest, the least significant
-
Moderate Values: average, moderate, mid-range
Describing Trends:
-
increase, rise, grow, climb, surge
-
decrease, decline, drop, fall
-
remain steady, stay constant, stabilise
Descriptive Adverbs:
-
significantly, dramatically, substantially
-
gradually, steadily
-
slightly, minimally
Useful Phrases:
-
“Technology accounted for the highest average monthly income.”
-
“Hospitality represented the lowest income among the industries.”
-
“There was a substantial gap between the top and bottom sectors.”
Common Pitfalls
-
Misinterpreting Data: Always ensure figures are accurately reported.
-
Omitting the Overview: Always include a summary of the main trends.
-
Excessive Detail: Focus on the major comparisons instead of mentioning every single figure.
-
Inconsistent Tenses: Use the past tense when describing historical data.
